


Regression to the Mean: NFL Turnover Margin

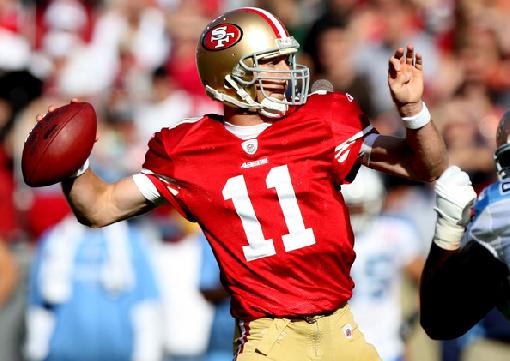
Can the 49ers sustain success if their turnover margin regresses?
Written by @JustinZovas
“Team A has got to take care of the football this week,” words every NFL fan will hear 1,047,683 times during the 2012 season. Turnover margin, the net difference between turnovers gained and turnovers lost , is a crucial factor in determining the outcome of a football game. Reasoning behind this is simple; in order to score (for most teams), you need the ball and turnovers lead to a change of possesion. End result? Turnover margins serve as a good reflection of a team’s success not only in terms of wins and losses but also how many games they’ll cover. For example, the Green Bay Packer’s turnover margin last season was +24 and the Packers ended the regular season 15-1 SU and 11-5 ATS. Conversely, the Washington Redskins struggled to hang onto the ball finishing 5-11 SU and 6-9-1 ATS because of a -14 turnover margin (aka the Rex Grossman effect).
Empirical data confirms the theory that turnover margins fluctuate from year to year and a team’s average turnover margin over the course of multiple seasons should end up close to zero. However, just like any other long term trend, there are random variances from year to year. Extremely high or low TO margins one season are typically followed by a massive regression to the mean the following year. As a byproduct of abnormally high (or low) turnover margins, significant changes from one year to the next create unrealistic expectations for teams. A team that experiences a dramatic improvement in turnover margin will their point spread inflate, reflecting an over valued side. After a season where a team benefits from fortuitous bounces, there will be a correction so we welcome the 2011 San Francisco 49ers into our 2012 equation. You’ll notice during the 9 year period in question, San Francisco had 4 seasons where their combined turnover margin was +59 and 5 seasons that combined for -65: a net yearly impact of -.7.

The 49ers had the NFL’s second greatest change in turnover margin increasing from a margin of -1 in 2010 to +28 in 2011. San Francisco didn’t disappoint for their loyal bettors as the team went from 7-9 ATS in 2010 to 13-3 ATS in 2011. Their incredible increase in fortunes through turnover margin allowed the 49ers to play to their maximum potential but unfortunately have nowhere to go but down in 2012 if history is any indication. I fully expect to see San Francisco over valued early in the year and believe there could be serious value fading this team on a weekly basis.
Conversely, the 2011 Pittsburgh Steelers were on the opposite end of the spectrum from San Francisco as the Steelers held the NFL’s dubious distinction of going from +13 in 2010 to -17 in 2011: a net effect of (-30!). The team’s success against the spread followed suit falling from 10-6 ATS in 2010 to 7-9 ATS during the 2011 campaign. It is unlikely the Steelers will experience another negative change in turnover margin given the huge fluctuation the last 2 years so history suggests a bounce back year for the Steelers and we say with confidence their ATS record will improve as well
Below is the turnover table from the entire league over the last two seasons and you can see the trends that begin to emerge tying an uptick in fortune to improved ATS results
| Team | 2011 TO Margin | 2010 TO Margin | Net Change | 2011 ATS | 2010 ATS |
| San Francisco | 28 | -1 | 29 | 13-3 | 7-9 |
| Green Bay | 24 | 10 | 14 | 11-5 | 9-7 |
| New England | 17 | 28 | -11 | 9-6-1 | 10-5-1 |
| Detriot | 11 | 4 | 7 | 7-8-1 | 12-4 |
| Seattle | 8 | -9 | 17 | 10-5-1 | 7-9 |
| Atlanta | 8 | 14 | -6 | 7-7-2 | 11-5 |
| NY Giants | 7 | -3 | 10 | 8-7-1 | 7-9 |
| Houston | 7 | 0 | 7 | 11-5 | 5-10-1 |
| Jacksonville | 5 | -15 | 20 | 7-9 | 9-7 |
| Dallas | 4 | 0 | 4 | 5-10-1 | 6-10 |
| Chicago | 2 | 4 | -2 | 7-8-1 | 9-6-1 |
| Baltimore | 2 | 7 | -5 | 8-7-1 | 8-7-1 |
| Buffalo | 1 | -17 | 18 | 6-9-1 | 8-7-1 |
| Carolina | 1 | -8 | 9 | 9-7 | 4-12 |
| Tennesse | 1 | -4 | 5 | 6-9-1 | 8-8 |
| Cleveland | 1 | -1 | 2 | 8-6-2 | 5-11 |
| Cincinnati | 0 | -8 | 8 | 8-6-2 | 7-9 |
| Kansas City | -2 | 9 | -11 | 9-7 | 9-7 |
| Minnesota | -3 | -11 | 8 | 6-8-2 | 6-10 |
| New Orleans | -3 | -6 | 3 | 12-4 | 6-10 |
| NY Jets | -3 | 9 | -12 | 6-10 | 9-7 |
| Oakland | -4 | -2 | -2 | 9-6-1 | 8-8 |
| St. Louis | -5 | 5 | -10 | 3-12-1 | 10-6 |
| Miami | -6 | -12 | 6 | 9-7 | 8-8 |
| San Diego | -7 | -6 | -1 | 6-10 | 8-8 |
| Denver | -12 | -9 | -3 | 7-8-1 | 6-10 |
| Indianapolis | -12 | -4 | -8 | 6-10 | 8-8 |
| Arizona | -13 | -5 | -8 | 9-7 | 5-11 |
| Pittsburgh | -13 | 17 | -30 | 7-9 | 10-6 |
| Washington | -14 | -4 | -10 | 6-9-1 | 10-5-1 |
| Philadelphia | -14 | 9 | -23 | 8-8 | 8-8 |
| Tampa Bay | -16 | 9 | -25 | 4-12 | 10-6 |