


What It Takes
The Westgate SuperContest is the world’s premiere NFL handicapping competition and the 2014 edition has once again generated a record number of entrants. This year’s prize pool comes from the 1,403 entries, representing a 36% increase in sign-ups from last year’s previous record high of 1,034 entries. The payouts have never been more lucrative, but the bar for picking NFL winners has also been raised.
Just how high is the SuperContest’s standard for football handicapping excellence? We can do some math to approximate the wins-needed to secure the juicy top prize of $736,575…before taxes of course.
Contestants will make a total of 85 picks over 17 weeks and assuming each selection has a 50% chance of winning, each entrant has an average expectation of 42.5 wins.
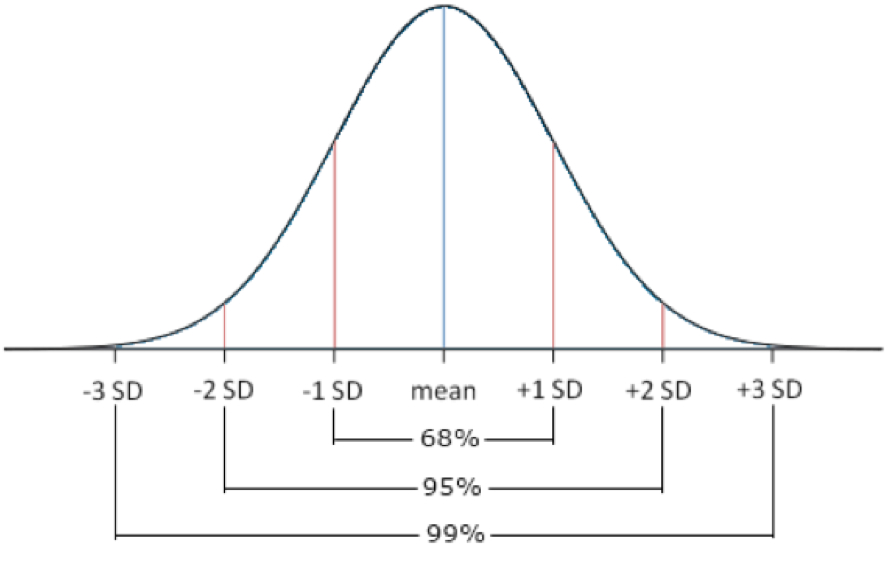
An entrant’s winning rate is normally distributed around a mean of 42.5 wins with a standard deviation of 4.61 wins. 68% of entrants (≈954 entries) will win between 37.89 and 47.11 games, 95% (≈1333) will win between 33.28 and 51.72 games, and 99.7% (≈1399) will win between 28.67 and 56.33 games.
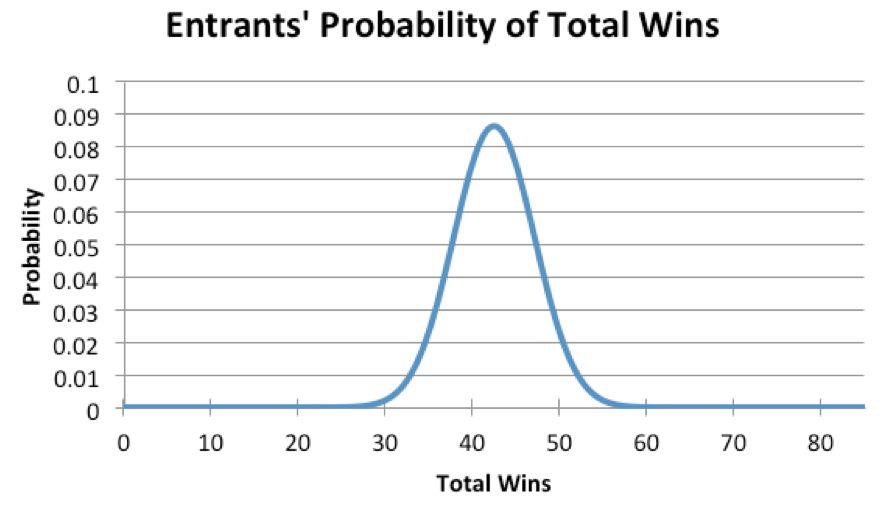
But what about the remaining four contestants that are expected to perform greater than three standard deviations from the mean? Two will be battling for the embarrassing result of last place (no prize pool for this just yet) while the other two will have plenty on the line come week 17.
The 2nd place finisher will finish in the 99.93 percentile which is equivalent to winning 57.20 games. In other words, the champion will need to pick winners at a rate better than 67.3% which is equivalent to a benchmark of 57.5 wins. Last year, the runner-up was expected to win 56.79 games which equated to a 66.8% win percentage, or a benchmark of 57 wins-needed (Sure enough, the 2013 champ, David Frohardt-Lane, finished with 57 wins). The additional 369 entrants in 2014 increased the expected success rate needed win the SuperContest by 0.5%, or roughly half a win. Here is a table summarizing how a higher number of entrants translate to a greater number of wins-needed to be crowned champion.
| 1st-Pace Wins-needed | ||
| Year | Entries | Benchmark Wins |
| 2011 | 517 | 56 |
| 2012 | 745 | 56.5 |
| 2013 | 1034 | 57 |
| 2014 | 1403 | 57.5 |
Anyone who says there’s no place for math in projecting results in sports handicapping clearly doesn’t understand the implication that numbers truly never lie.